
Jul 13, 2022
Innovation
Cindy Tarasow
HR & Analytics Specialist, Cindy has over two decades of strategic Human Resources experience across a range of private and sectors, positioning her to serve Payworks’ clients as a subject matter expert. She is driven to translate organizational challenges into opportunities by enabling organizations to leverage business intelligence to guide strategy and decision-making. Spécialiste en RH et analytique, Payworks Cindy possède plus de deux décennies d’expérience stratégique en ressources humaines dans divers secteurs privés et publics, ce qui lui permet de servir les clients de Payworks en tant qu’experte en la matière. Elle est motivée par la transformation de défis organisationnels complexes en occasions de recueillir et de gérer des données, permettant ainsi aux organisations de tirer parti de l’intelligence économique pour orienter leur stratégie et leur prise de décisions.Share this article

In the four years since Payworks launched Workforce Analytics, we’ve been driven each day by the goal of knowledge building and sharing… and the understanding that the most informed decisions are typically the best ones.
We’re especially grateful that this flow of information goes both ways!
Each week, we offer an Analytics training webinar. Not only do these sessions provide us with the chance to share Analytics best practices and ideas with our clients; we get to hear what’s been working well for them and discover potential new uses or improvements that can make the application even more valuable.
Here are just some of the ways our clients are benefitting from Analytics - how could these be applied to your business?
1. Get to know your people…
Many business owners with sales teams have shared that they’re leveraging Analytics’ ability to visually assemble, order, review and easily export wage data. Combining this with external sales data is “a huge win” when it comes to shining a data-driven spotlight (as opposed to an anecdotal one) on their sales superstars and managing their workforce.
HR teams are exploring data on benefits enrollment and cross-referencing with demographic data in order to develop the most effective plans for their team’s unique needs, and payroll professionals are able to provide strategic guidance to the C-Suite based on year-over-year analyses of overtime against wages, hours and cost centres.
Their takeaway? The better you know your team, the better you can serve them (and the business!).
Analytics Pro Tip:
Explore powerful information views that include data across multiple years, like the ability to compare this year’s data against last year’s for the same period.
2. …and use that knowledge to develop your retention strategy.
With the “Great Resignation” looming large in the minds of many leaders, several clients have shared that they’re using Analytics to identify risk when it comes to turnover. They’re analyzing data on past employee departures by looking at everything from age and gender to length of service, department and occupation to spot trends and proactively develop solutions.
These clients are also using Analytics for month-over-month or year-over-year turnover comparisons (whether for the business as a whole or certain regions, departments or working groups). This provides helpful context for any trends these clients are spotting, and fast-forwards them to address the issues.
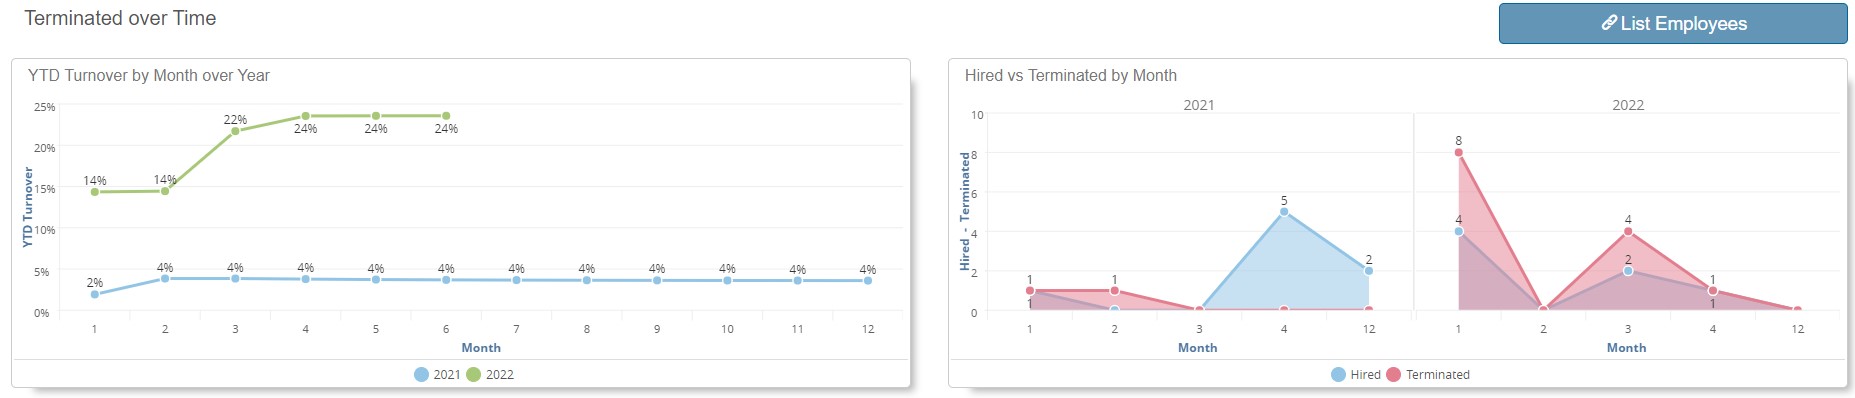
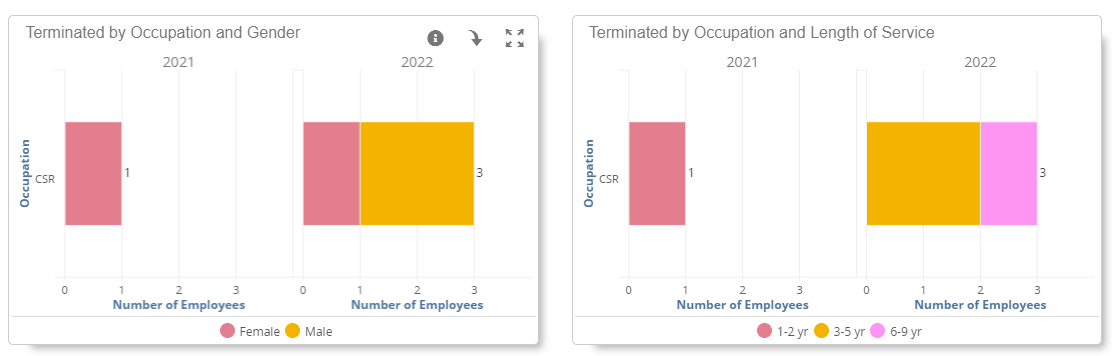
Image description: In this basic example, Analytics graphics indicate that turnover increased by 100% over previous years for employees identifying as female and having three to five years of experience.
Analytics Pro Tips:
Leverage pre-built charts and graphs to view business data and apply filters to immediately see a subset of your information.
Set bookmarks to keep favourite filters applied to graphs, saving time in the future.
3. Be open to redefining the fundamentals.
Further to those clients who were taking a closer look at overtime, a client shared that their review of the relevant Analytics prompted their team to segment the definition of “overtime”, splitting out administrative vs profit-driven hours, in order to first understand the cause and ultimately maximize efficiency.
To reduce rapidly-rising mileage reimbursement expenses, another organization took a closer look at employees’ home locations and incorporated that information into selecting the most cost-effective business locations for training and scheduling.
If your business deals with a lot of unexpected or short-notice absences, you may want to take a page from the book of clients who are analyzing these occurrences. Tracking different types of absences provides them with data that can be quickly viewed in Analytics to understand patterns and take first steps in remedying problems.
Intrigued? Some clients take it another step further, cross-referencing these absences against overtime to identify patterns of extra hours worked (and money earned) followed shortly by paid or unpaid time off. Sharing this Analytics data with those in your business responsible for overseeing overtime is a great foundation for evidence-based conversations around staffing, scheduling and more.
Analytics Pro Tip:
Add payroll or absence type elements to access insightful data analytics. What gets measured gets managed!
4. Invest wisely!
No matter your business, you want to make sure you’re getting the most from every dollar invested. Analytics can help!
Some larger clients are reviewing pay-period-over-pay-period labour costs between franchise or dealership locations, or between districts and regions, and strategically categorizing wage or payroll hour details into direct or indirect labour costs. Whether it’s to solve the problem of monitoring unique configurations of people’s wages and benefit costs, or to balance against a fixed funding budget, cohorts can be grouped and bookmarked for easy repeat analysis.
In other cases, we’ve heard of clients who are now tracking their investment in staff training (both costs and time) to compare against other company data such as sales, customer feedback and even accident frequency.
Another client reported using Analytics to identify and measure the few employees who were taking the most time off (and therefore increasing scheduling disruptions), and which areas experienced the most disproportionate volume of issues. Once identified, they understood where they should invest more resources into coaching, training and support.
Analytics Pro Tip:
Consolidate data from workforce management solutions such as payroll, HR, and absence management with no need to re-enter or re-key data.
5. Leverage Analytics across roles to inform a united perspective.
When we first started running our weekly Analytics training sessions, 90% of attendees were payroll professionals. But over the last year, we saw a much wider variety of roles in attendance, including Human Resources, Executive and Operations roles.
We were particularly pleased to see that almost a quarter of these attendees were referred by other Payworks clients or colleagues within their own organization who are clearly seeing the value of both the Analytics application and the training!
Analytics Pro Tip:
Answer questions you didn’t even know you had by discovering trends in almost every area of your business.
Now you know their stories… but what about yours? To start exploring what Analytics can do for you and your organization, please contact sales@payworks.ca.
Key topics in this article:
InnovationAnalyticsFinanceBusiness OwnerHR ManagementAccountantBookkeeperThese articles are produced by Payworks as an information service. They are not intended to substitute professional legal, regulatory, tax, or financial advice. Readers must rely on their own advisors, as applicable, for such advice.